Overview
In this post, deep learning methods for Urban feature extraction are presented and discussed. Computer Vision methods have greatly affected the way in which we measure contextual attributes from our urban environments.
Extensive literature has assessed the application of different CNN (Convolutional Neural Network)-based methods to extract facade elements and segment different features. However, how do these methods translate to building performance studies, specifically with the kinds of assessments that are typically used to evaluate different building performance phenomena (such as building energy use)? Moreover, what is the kind of data that needs to be collected and at what resolution? The post intends to break this down along with a discussion on data acquisition. Finally, a case study will be presented for window extraction.
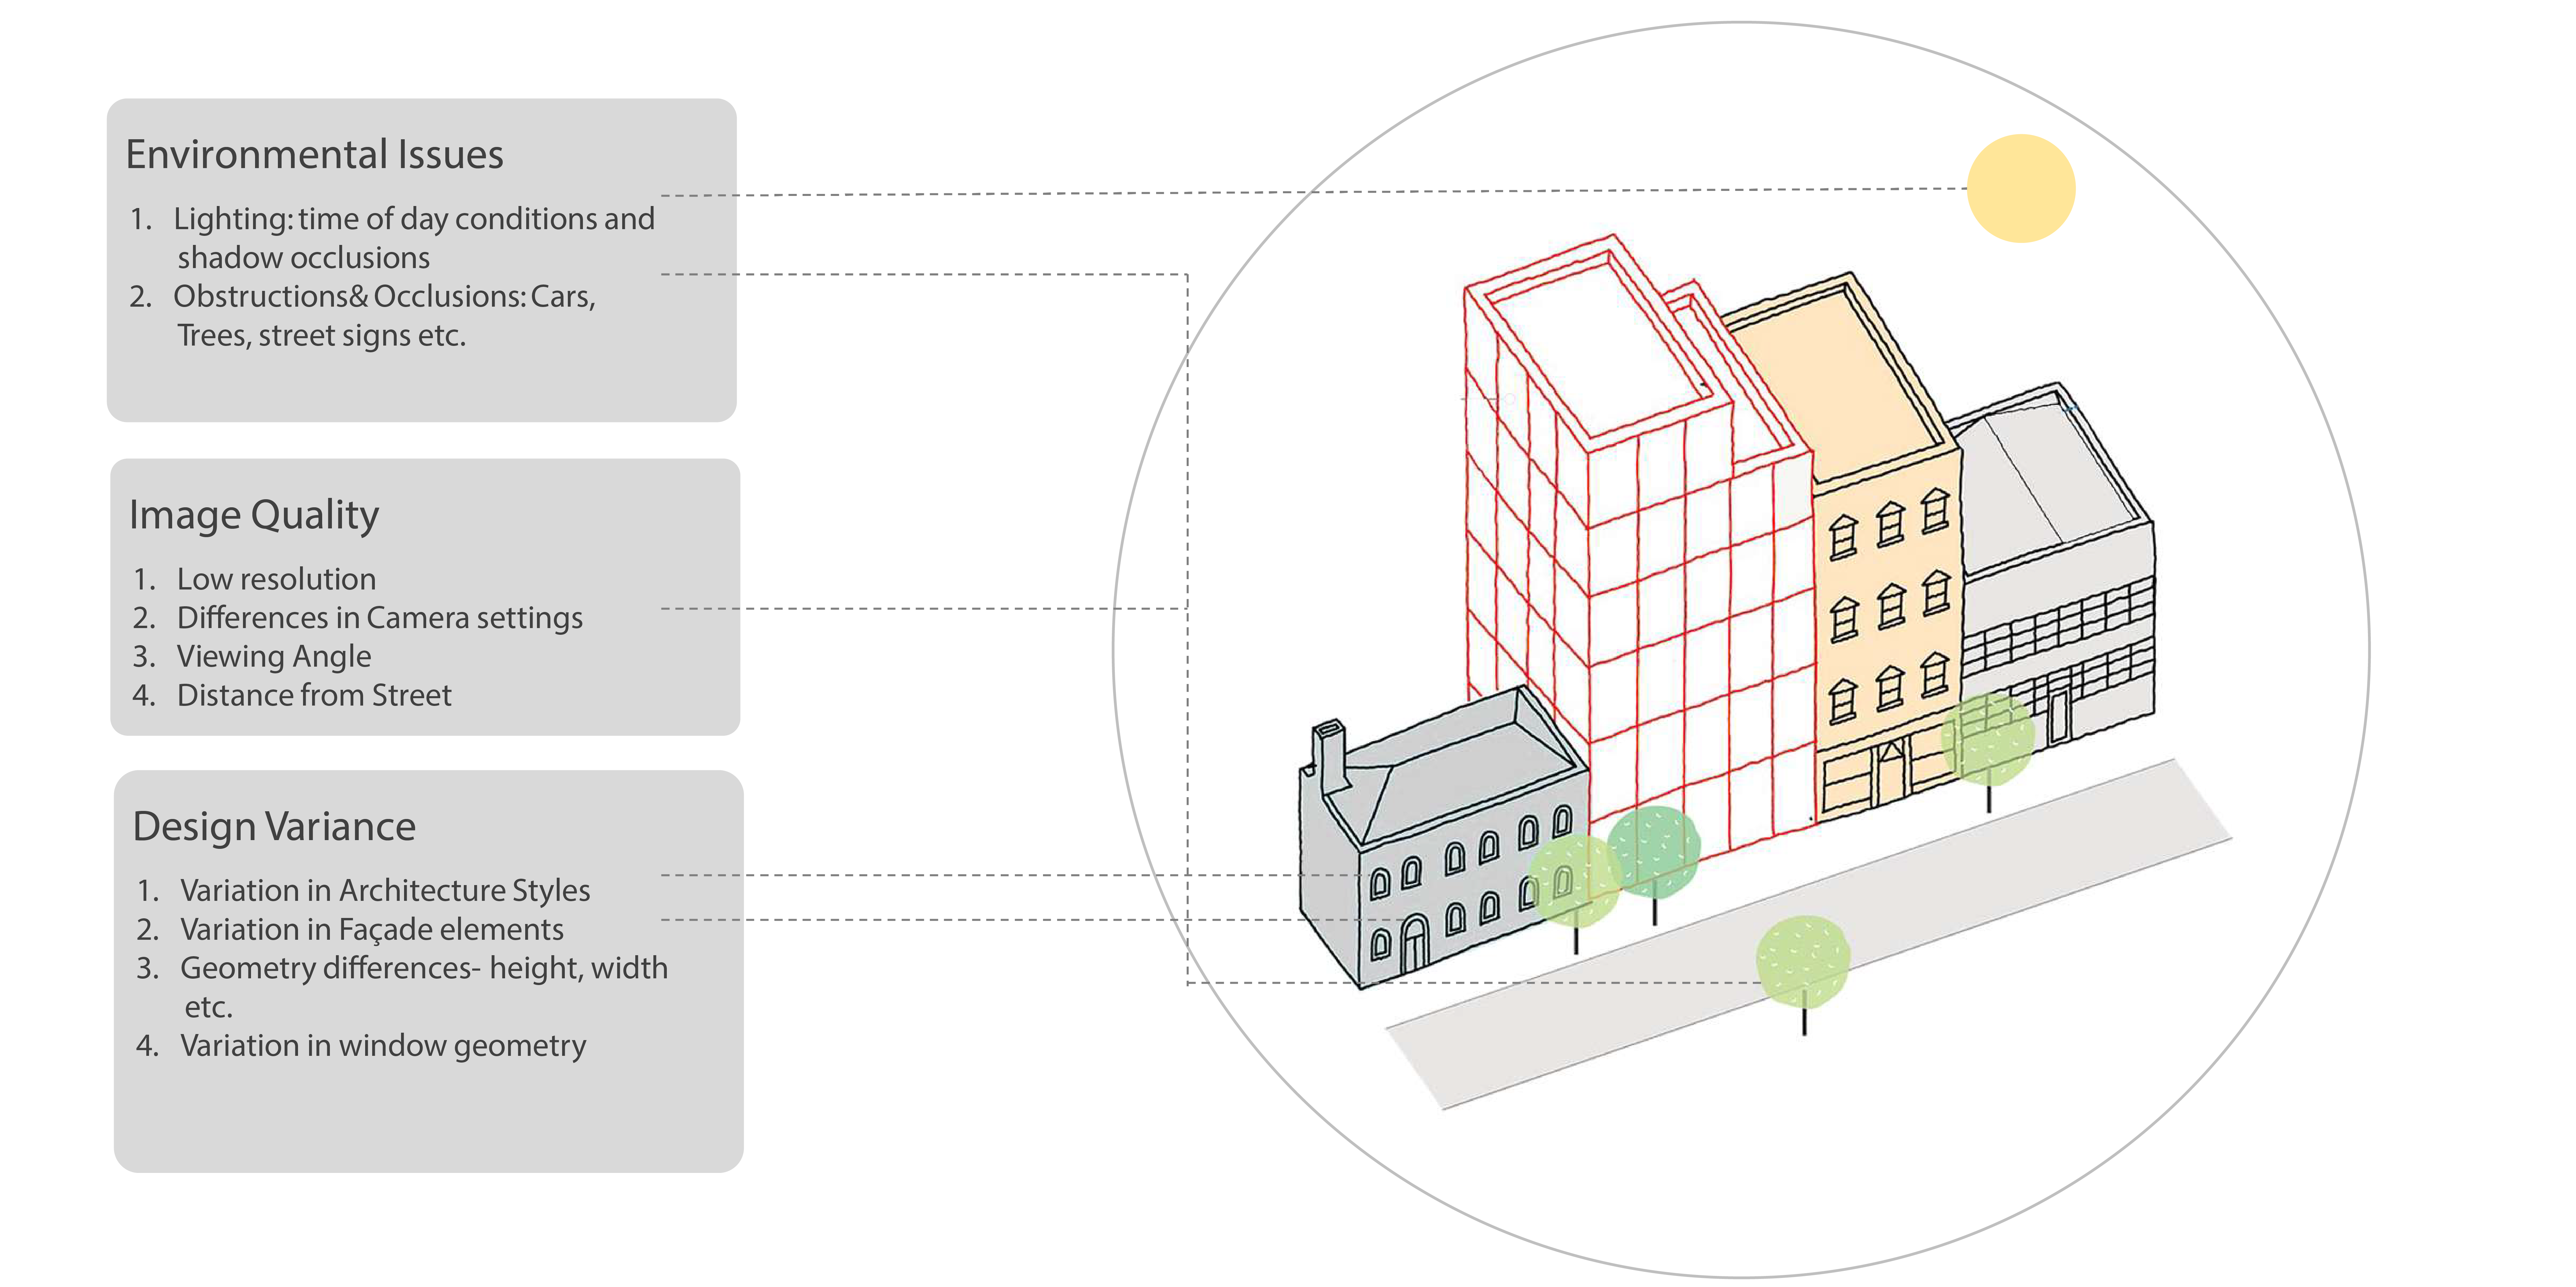
Challenge 1: Urban Diversity and ScaleThe Urban environment is very diverse. There is no universal way to standardize the rules needed to interpret different contexts and architecture around the world. Some of those diversities are represented in the form of the following parameters; building heights, density, urban vegetation, design styles, construction period and building materials.
Challenge 2: Method Matching NeededThe challenge here lies in selecting extraction methods that match the task at hand. This depends on the granularity of information that is needed such as precise area, dimensions and location.. This is expanded upon in the experiments section when an example extraction task is carried out and assessed.
Challenge 3: Data QualityAs with most machine learning tasks, models are data hungry. As this application represents a more domain specific application, the data quality and quantity is imperative to make sound assumptions in simulaiton models. In this application, street view imagery has been the most promising data source, yet does not come without challenges and biases. In the Data Acquisition section, the data retrieval and labelling process is discussed.

The below blog aims to lay out the following:
Urban & Building Analyses: Input Features
In this section, the main parameters needed for 3 distinct types of building performance studies are outlined. For each study, a set of inputs are required that are often very tedious to collect through manual methods. At the same time, in the absence of this data many high level assumptions need to be made which can be inaccurate. Hence, automating this data retrieval in the context of urban environments is imperative to the accuracy of these assessment models.
Expand the nodes to view the building attributes required for each analysis!
Energy
This mainly involves whole building/urban energy simulations that looks to quantify annual energy use over the course of a year. These simulations take in various building properties as well as the specific urban context and climate files to conduct multi-physics calculations
Daylighting
This assessment involves simulating building models to evaluate the percentage of occupied time in which a certain daylight threshold is met or exceeded. This is highly dependent on window design and placement as well as annual sun exposure.
Outdoor Thermal Comfort
This assessment factors in thermal properties of an environment to give a measure of thermal satisfaction based on human physiological models.
Indoor Thermal Comfort
This study aims to achieve the same goal as the above but with internal thermal properties while utilizing indoor thermal comfort thresholds.
Extraction Methods
As noted earlier, many computer vision methods have been applied to the area of urban feature extraction. Below are the most notable contributions to this area, categorized under their respective methods and models:
Grammar Based MethodsThese approaches center on procedural shape grammar definitions. At a high level, this method is usually made up of a set of hand-crafted rules of basic shapes which represents structured geometries encoded as parametric sub-divisions. These rules can then be applied to images to make deductions on hierarchies and the presence of certain elements. Although intuitive to construct, hand-crafted features, based on methods such as sobel operators, usually suffer when handling more diverse conditions, especially when dealing with noisy street view imagery and architectural styles that fall outside the constrained set of pre-defined rules. In addition to this, the extensive computational time does not justify the limited inference capability.
Learning Based MethodsCNNs
Recently, Convolutional Neural Networks (CNNs) have dominated image analysis tasks due to their superior performance across classification, object detection, semantic segmentation and image segmentation tasks. CNNs have been applied extensively to facade parsing tasks with varying architectures and model set-ups. CNNs take in an input image, assign learnable weights and biases to various features in the image and output segmented images based on the detected classes. This is mainly carried out through the application of relevant filters. Below, the variations of CNNs applied to facade parsing applications is covered.
Polygon RNN
Contrasting current object segmentation tasks under CNNs where they are treated as pixel-labeling problems, Polygon RNN casts this as a polygon prediction task, matching the annotation style of most annotation datasets.
Panoptic Segmentation
Panoptic segmentation unifies the typically distinct tasks of semantic segmentation (assign a class label to each pixel) and instance segmentation (detect and segment each object instance).
Hover on the below to view the respective method category and click to be navigated to the research on the method!
A History of Facade Parsing
More specific to facade parsing, below is a brief literature review that gives an outlook into the methods utilized and the dataset used. Below, the transfer learning component is highlighted as this has been shown to improve efficieny as it reduces the resources and amount of labelled data required to train new models.
Zhao, et al., 2010
proposed parsing using procedural grammars

Wendel, et al., 2010
Utilized Scale–Invariant Feature Trans-form (SIFT)
Mathias, 2011
Utilized inverse procedural modeling
Schmitz, et al., 2016
Transfer Learning and small model size
Fathalla, et al., 2017
Introduced used appearance &layout cues + VGG model.

Koch, et al., 2018
Utilizes multi-scale patch-based pattern extraction + CNN

, Bacharidis et al., 2020
Combined generative adversarial networks (GANs)

Hu, et al., 2020
Uses bounding boxes detection by using
YOLO architecture in real-time

Wenguang et al., 2020
FasterR-CNN architecture for window detection.
Nordmark et al., 2021
Utilizes Regional Proposal Network
The brief history of facade parsing methods shows the following trends:
To present a degree of specificity to the subject matter, the below presents the customized extraction task of window to wall ratios for energy and daylight studies. In these studies, the window to wall ratio is a large driver behind thermal envelope performance as well as daylight access. For more granular assessments, deriving the exact window area would be needed hence, bounding box methods indicating location of windows (with imprecise annotation geometry) would not be sufficient in this case. Similarly, we can argue that for applications requiring height estimation, it would be beneficial to have calibrated (actual) building heights rather than a ratio/proportion between the different object heights in a scene (Trees, buildings etc.)
Data Set: Acquisition & Labelling
Automating the collection of semantic data regarding building features is required to carry out this task. Manual data acquisition methods can be extremely challenging and time consuming. For example, information regarding location, shapes and sizes, materials of building structures can change over time and hence datasets would need to be both reliable and up to date. In this section we discuss the data resolutions, properties and how it is sourced.
Data ConsiderationsRELIABILITY
Street View imagery is often quite noisy and requires heavy preprocessing and rectification. The process of data acquisition starts with automating the extraction of frontal facade images. This is done through calculating the camera bearing angle and identifying the centerpoint of the building of interest. Next, a rectification procedure requiring homography is applied such that an orthogonal fronto-parallel image is produced.
AVAILABILITY
Drawing on the previous point, while several platforms have enabled wide access to street-view data, data can sometimes still be quite sparse in various locations around the world. In the case of this example, the data was obtained from Google Street View Imagery.
QUALITY/QUANTITY
As the goal is to collect data for building performance studies, we must be presented with a sufficient data set that widely encompasses different building typologies, uses, construction periods and neighbourhoods. As with all learning problems, sparcity of data may result in biased deductions and inferences. The below diagram summarizes additional data challenges that are specific to urban contexts and buildings.
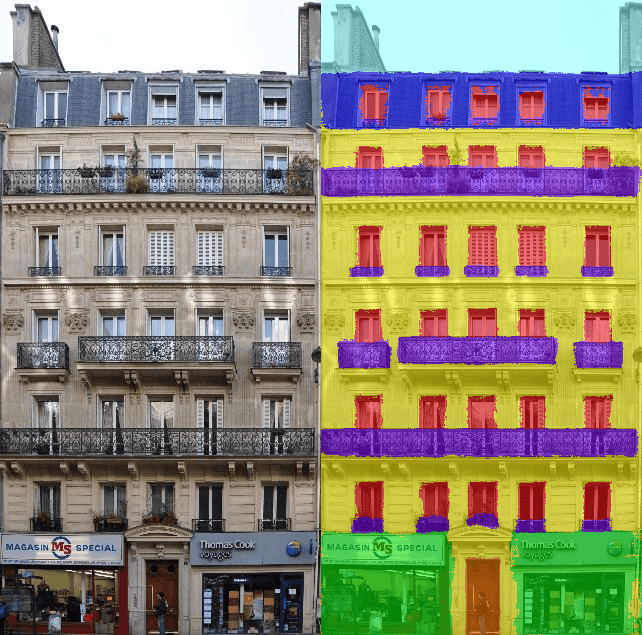
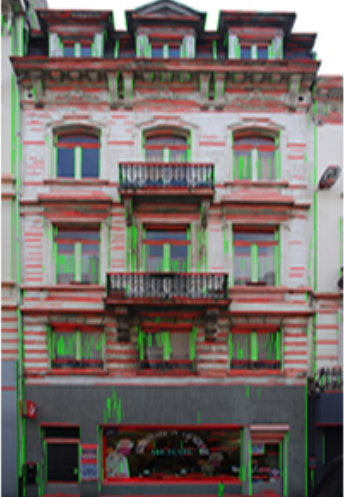
The training data included annotated images that were sourced from the following public facade datasets; TSG-20○2, TSG-60○3, ZuBuD○4, CMP and ECP. To improve model performance, additional labeled data was added. These manual annotations of window geometry were labelled using the labelme tool.Retaining the order of corner points was imperative to this labelling process- an example on a facade is shown below:

As we can see, this can be a very time-consuming process that could benefit from automation and publicly avaialable annotated datasets.
Experiments
Model DescriptionTo experiment with the use of CNNS in window detection, we utilize a framework developed by Li, Chuan-Kang, et al [1]. The method employs a key-point detection framework that utilizes CNNs to make predictions on the presence of window geometry by identifying corners. Resnet is utilized as the backbone network followed by 2 prediction branches. One provides heatmaps (for corner points) while the other provides tagmaps (based on grouping of windows and center verification).
The input image is fed into the CNN architecture, called the backbone. It is a pre-trained standard convolutional neural network, using ResNet to detect low resolution features. The backbone network acts as a feature extractor over an entire image.
This workflow along with the model parameters is highlighted below.
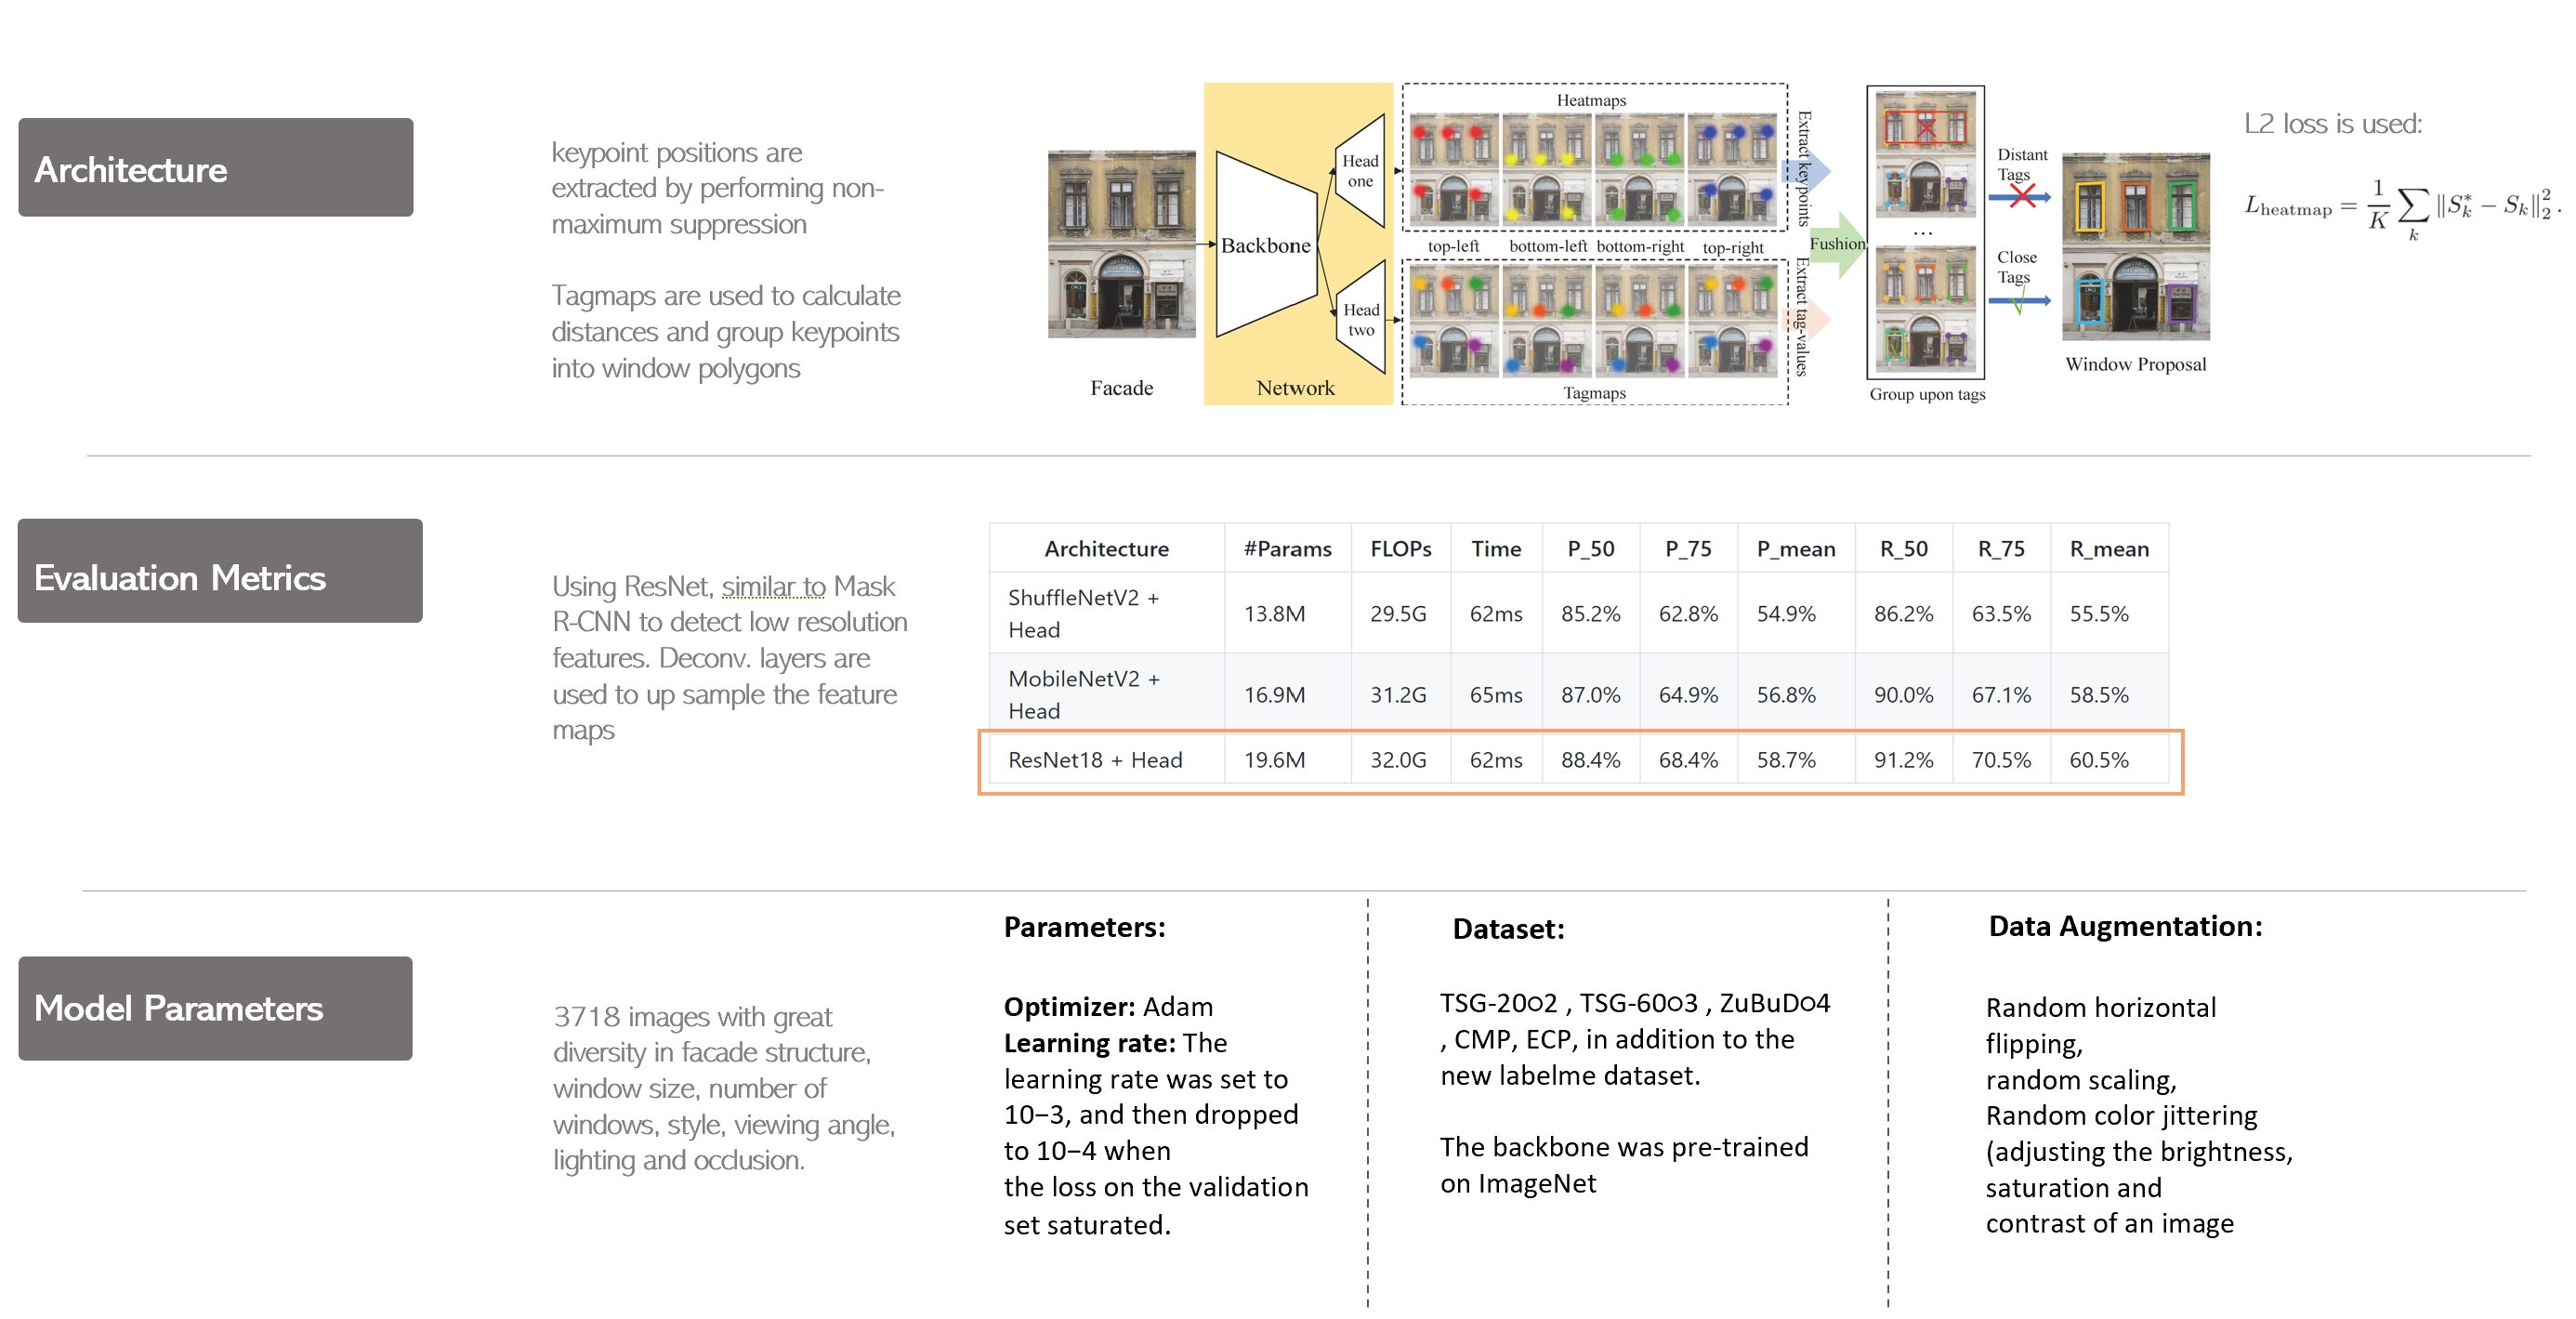
Summary of CNN detection method utilized
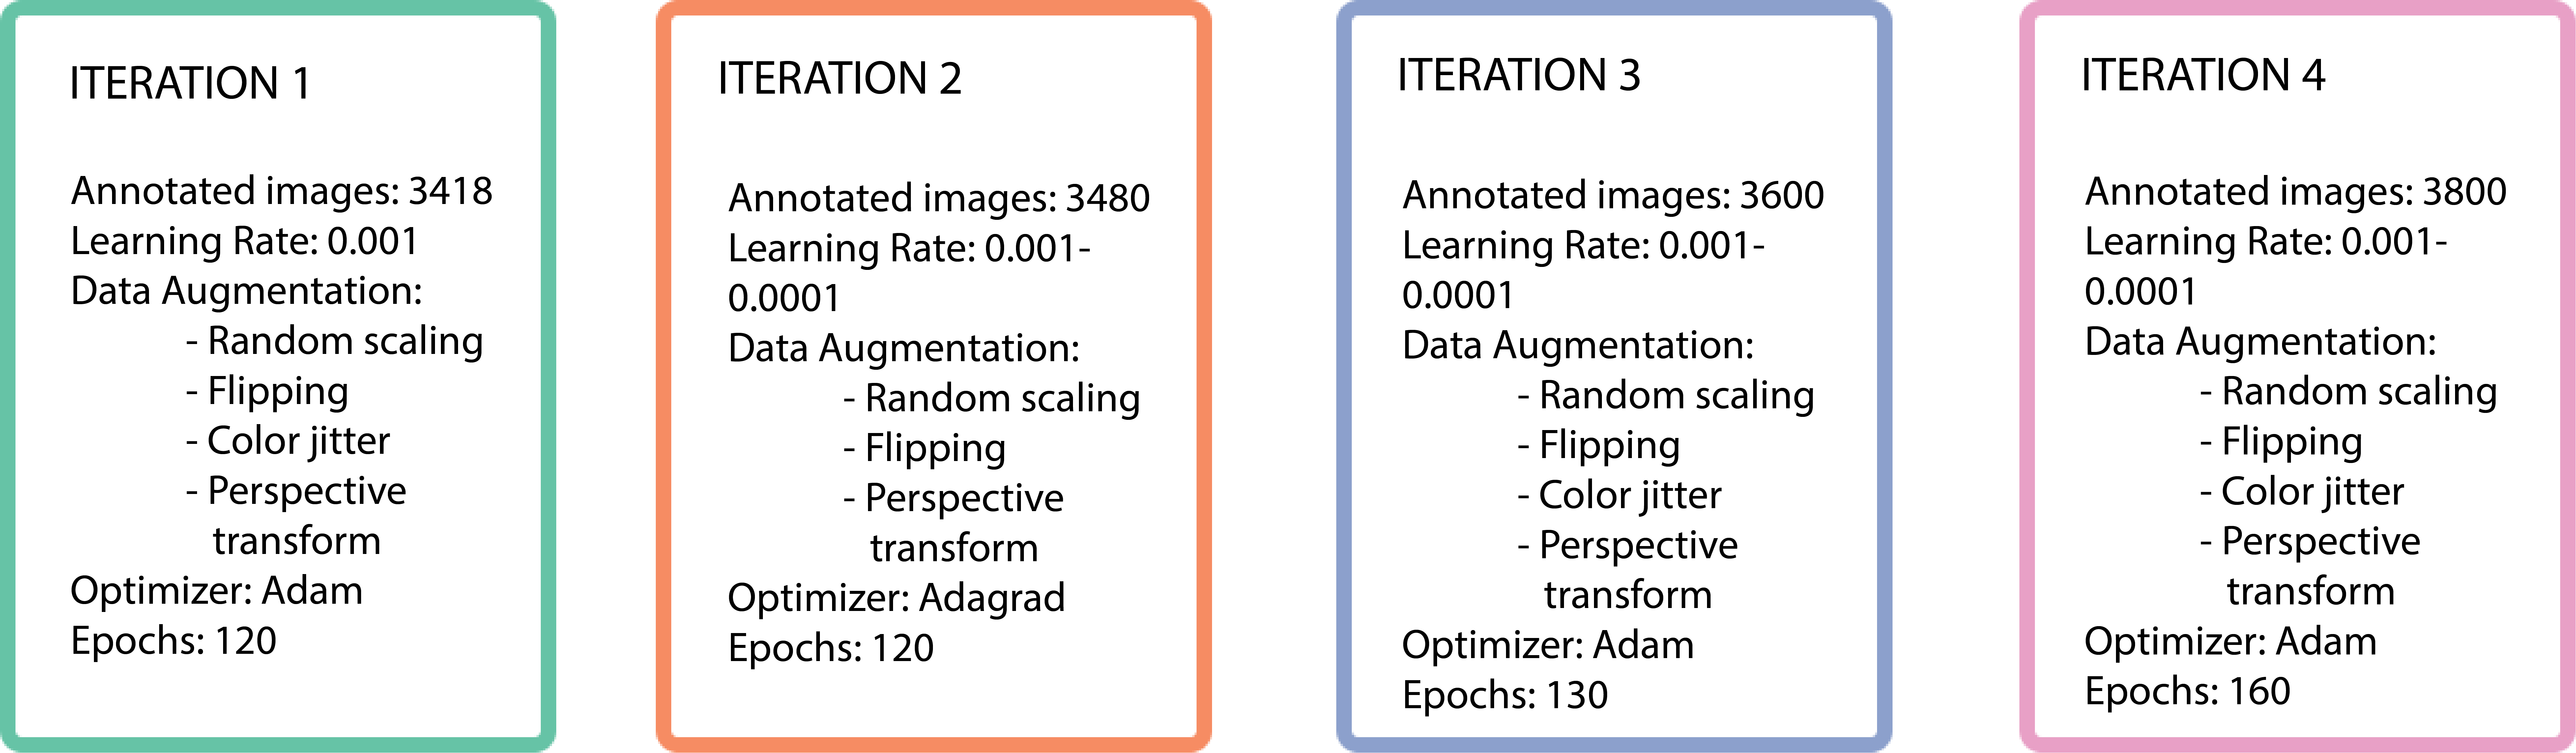
The training process involved a few iterations. Below, the iterations that yielded performance improvements are plotted. The number of training epochs against the loss are displayed along with the specific iteration changes. The iterations mainly involved different data augmentation methods, more annotated data as inputs and longer training durations. We see a steady decline in loss values as we increase training time and feed the model more data, which is as expected.
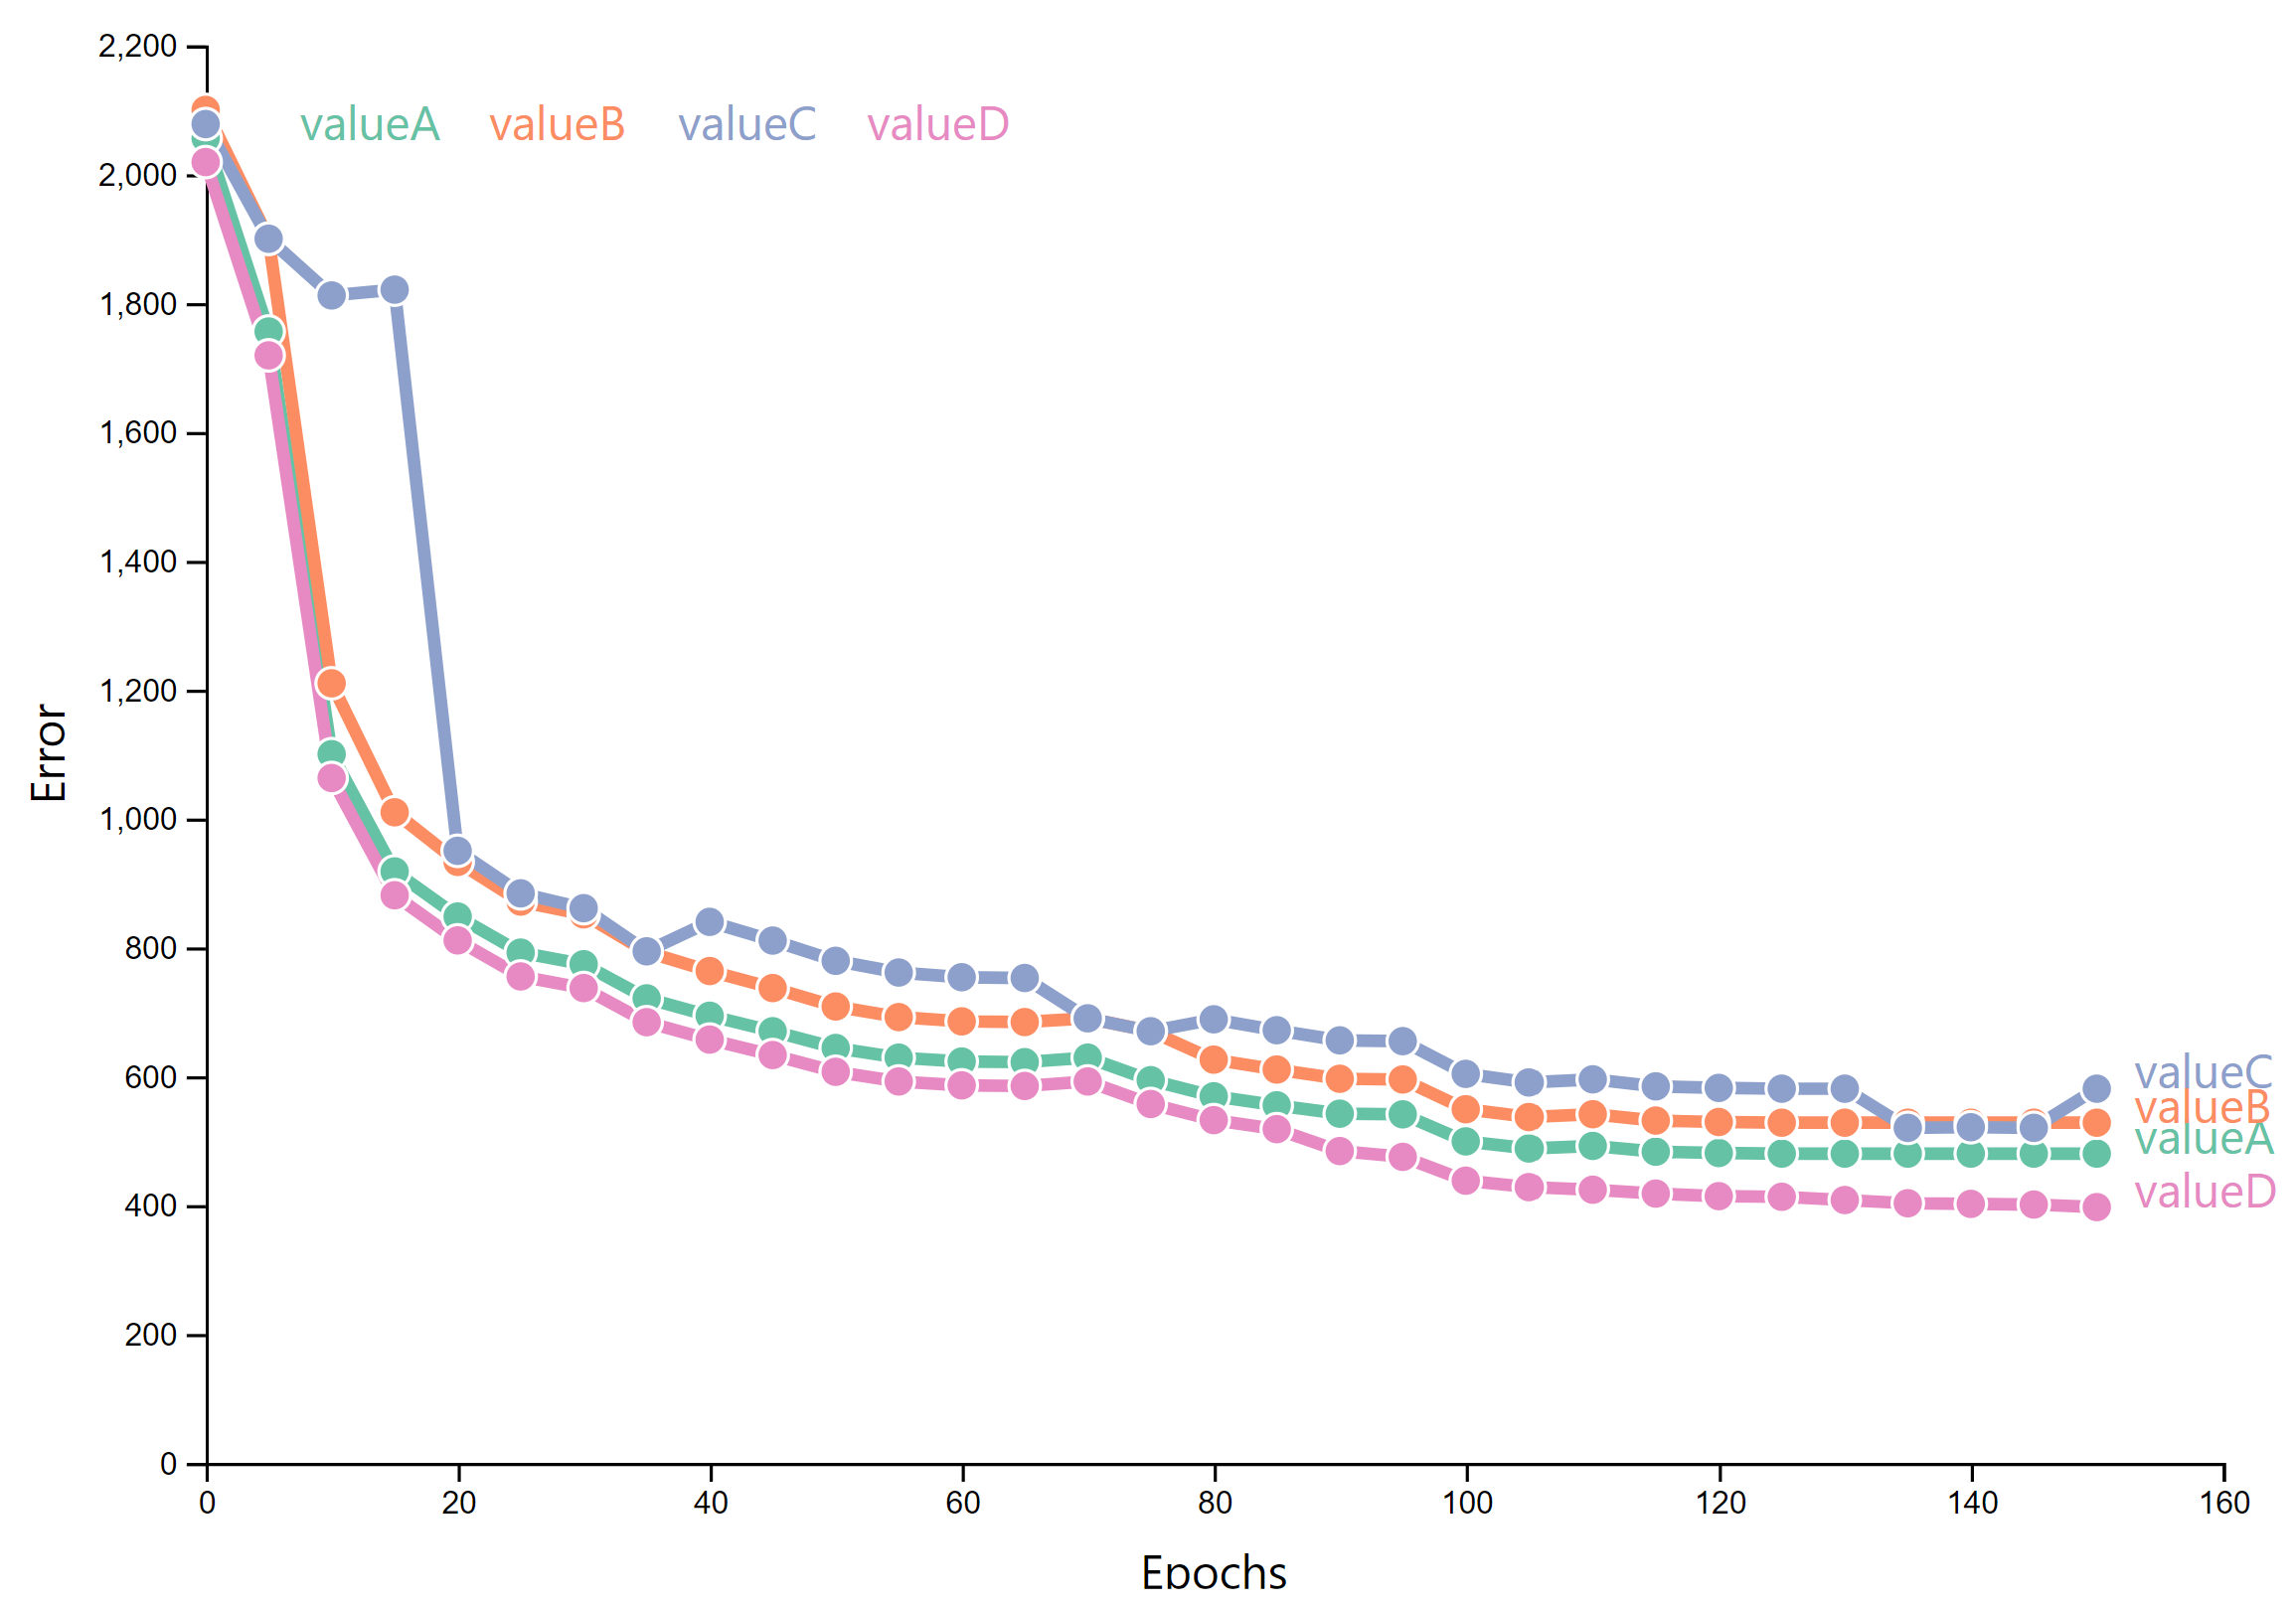
Model Training Iterations for CNN Model
Following the model training procedures, this experiment involved segmenting the data into different batches of assessment and then measuring performance on these batches. The batches of images were organized into three categories; Design variations, Environmental variations and Contextual Variations. These are explained further in the table below.
| DESIGN | Description: Includes design variations including conditions where model showed low prediction performance. This includes; small windows and dense facades, fully glazed facades, large buildings, special conditions such as window insets, heavy facade textures etc. |
|---|---|
| ENVIRONMENT | Description: Includes environmental variations such as lighting conditions, shadow occlusions and low resolution images from street view imagery. |
| CONTEXT | Description: Even though diversity in architectural styles is a core goal, not all design styles can be captured. The training data images have facades from all around the world however since we want to conduct analysis in specific locations, data from New York and Lisbon were a bigger focus. |

CNN Model Performance Scores- Comparison of Iteration 1 and 4
IOU Metric:The Intersection over Union (IoU) metric is a method to quantify the percent overlap between the target mask and our prediction output. A higher IOU indicates better prediction performance
Precision (over 50% IoU): The amount of positive predictions that were correct.Calculation: true positives / number of predicted positives.
Recall (over 50% IoU): The percentage of positive cases that were caught. Calculation: true positives / number of actual positives
Results:The results we see here compare the above scores from 2 models; iteration 1 and iteration 4 (as highlighted under the training section). We see significant performance across all three metrics especially when looking at the IoU scores.
Qualitative ScoringHow then can we evaluate the CNN method performance against more traditional non-learning based methods? To answer this question a comparison between two methods is carried out; Method 1 uses grammar based sobel operators for edge detection as carried out by Szcześniak et al [2]. And Method 2 utilizes CNNs as highlighted under model description. Below is a checklist of evaluation criteria that captures how effective the method is at sufficiently evaluating important attributes.
Criteria |
Method 1: Pixel Counting |
Method 2: Keypoint Detection using CNNs |
|---|---|---|
| Non-uniform window alignment | Windows must be on uniform gridding | Achieved ✓ |
| Non-uniform Window geometry | Angled non-rectangular forms not detected | Arched forms detected as orthogonal |
| Multi-material facades | Misclassification as windows can occur | Achieved ✓ |
| Textures and patterns | Texture lines may be mis-classified as edges | Achieved ✓ |
| Lighting conditions and shadow occlusions | Achieved ✓ | Achieved ✓ |
| Fully Glazed Facades | Achieved ✓ | Additional training data was required to improve detection in this condition |
| Façade obstruction elements (balconies, staircases) | Mis-classification as windows can occur | Achieved ✓ |
| Densely populated facades | Achieved ✓ | Additional training data was required to improve detection in this condition |
| Depth perception (inset windows) | This may sometimes not be detected by algorithm | Achieved ✓ |
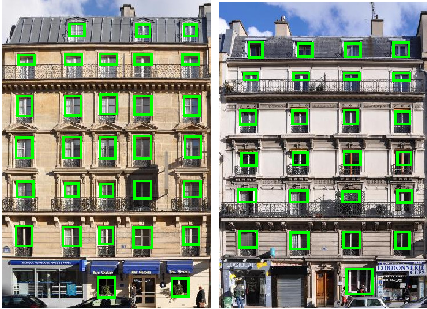
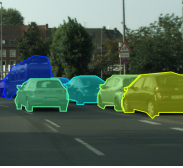
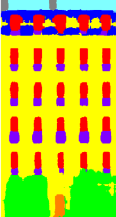
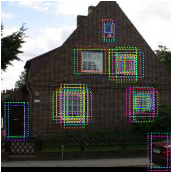
Below is a set of facades of different conditions and diversities. The Green box annotation captures the detected window extents. The grammar based method represents the utilization of sobel operators. As summarized in the table above, we see the pixel based method failing in more complex facade designs, where other facade elements are mistaken for windows.
Method Comparison Results
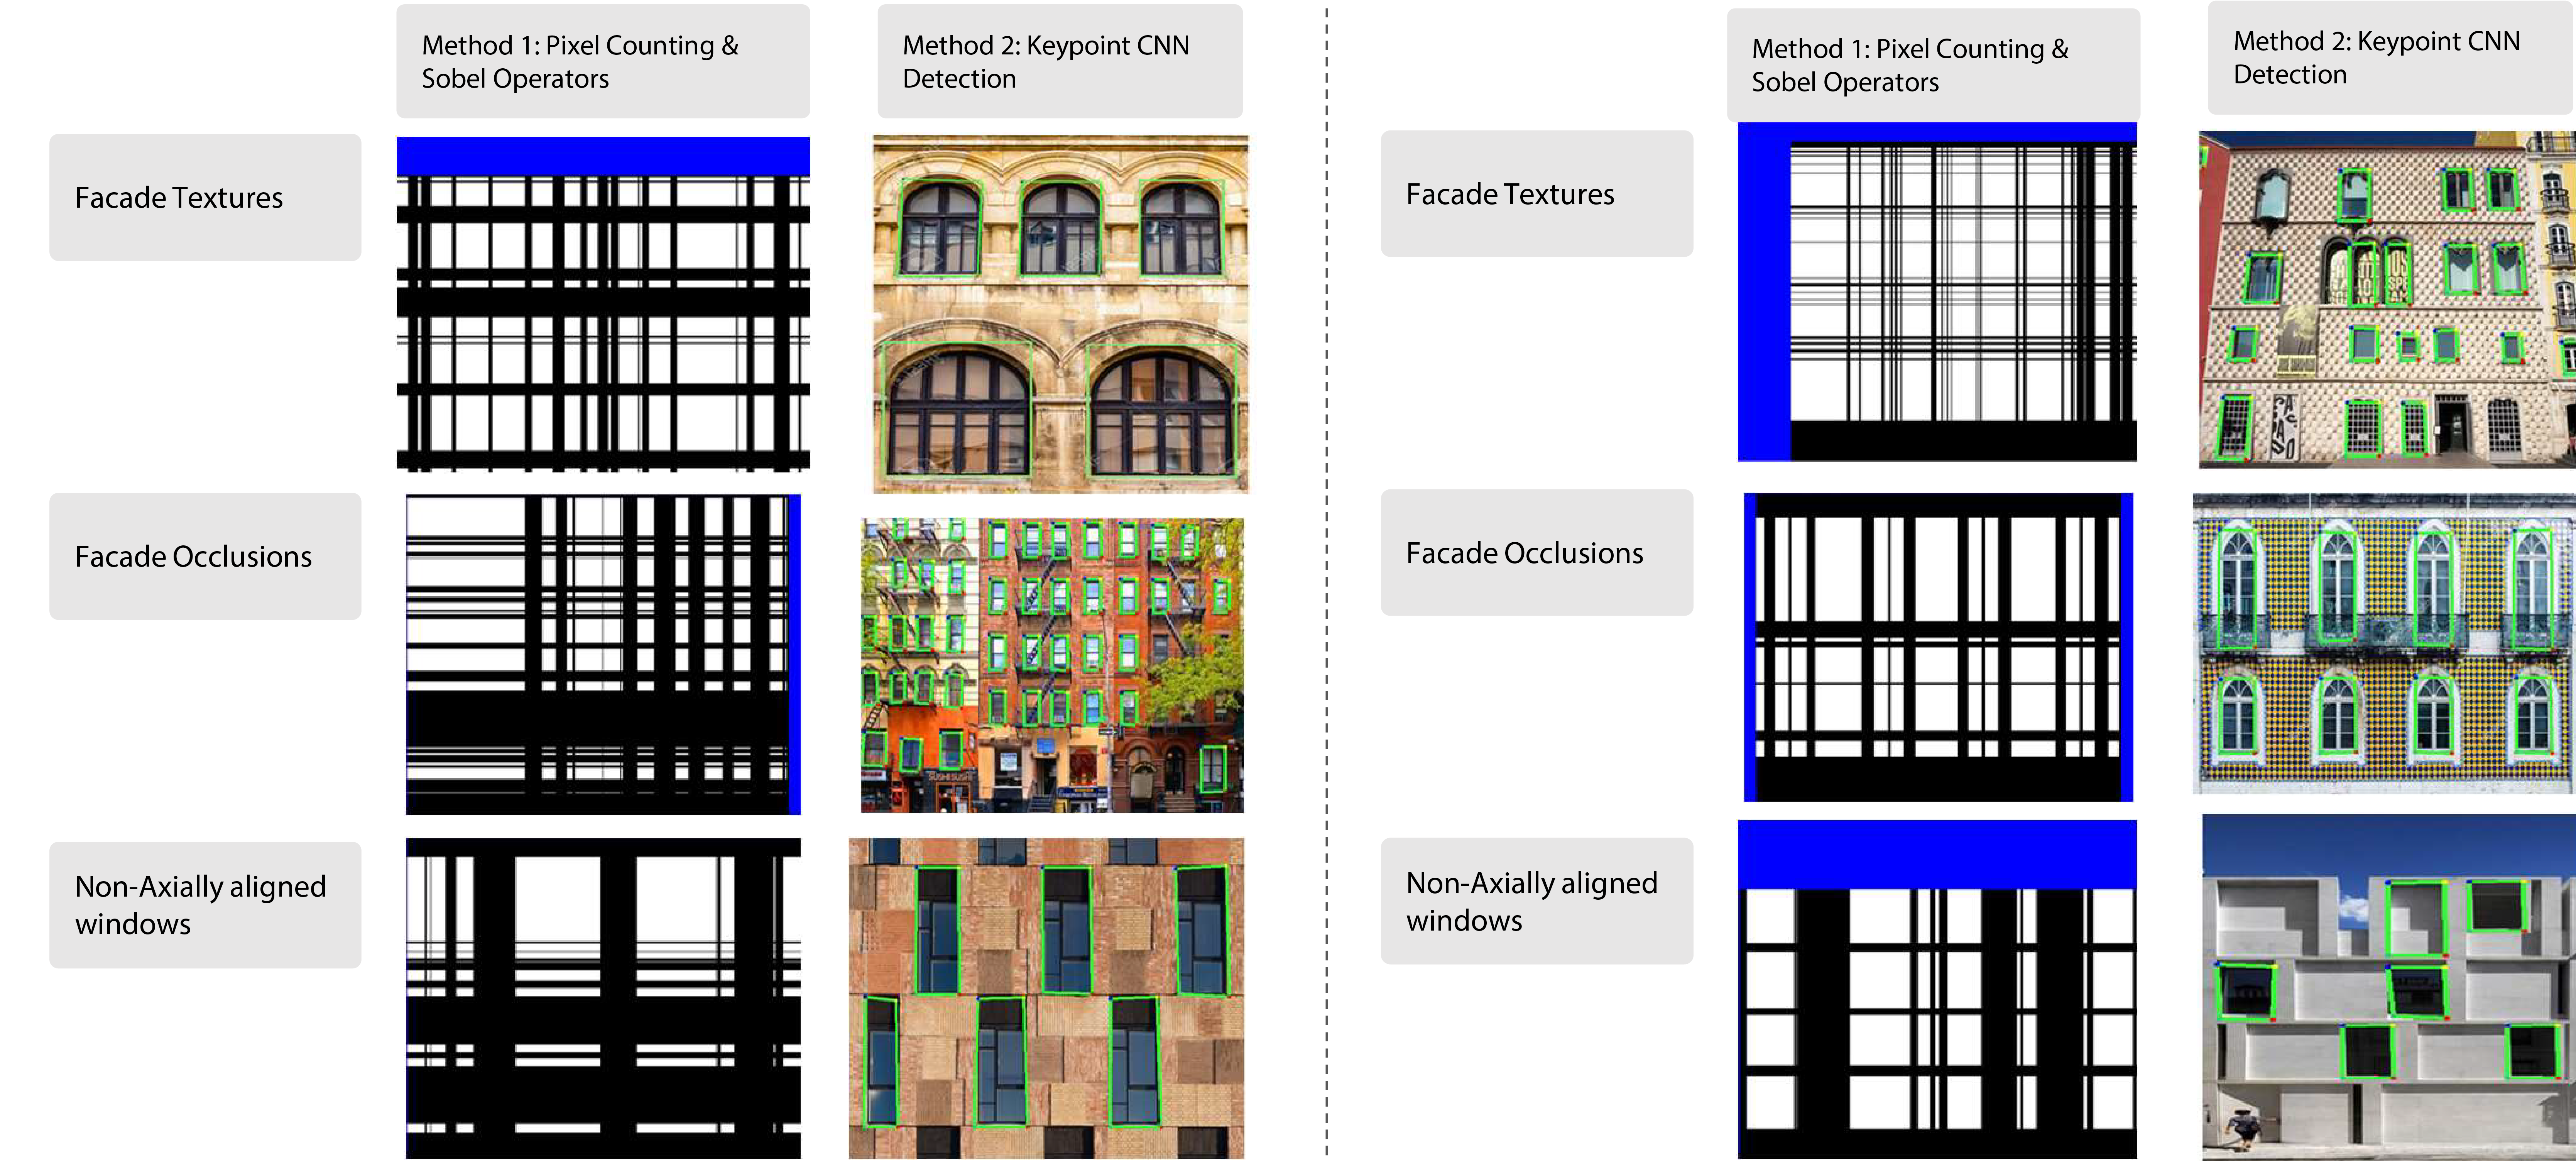
Images showing detection differences between Grammar based method and CNN Model
Results showing detection in Facade Diversity

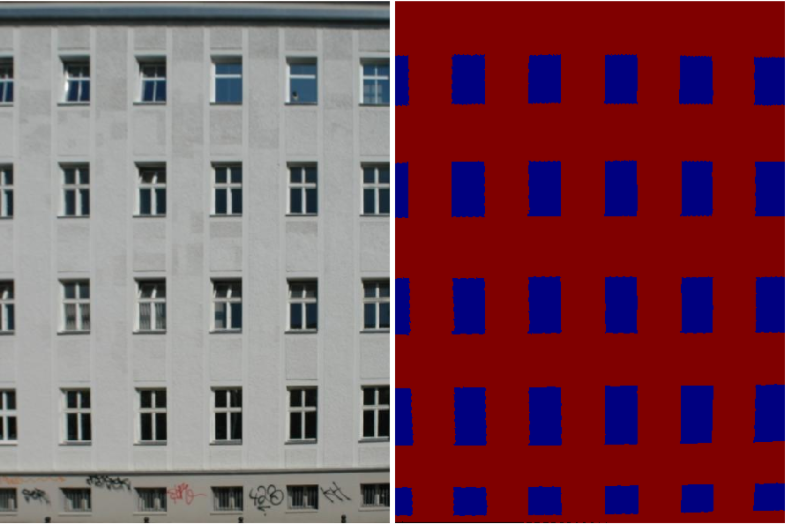
Results from CNN Model
Results showing CNN- Model Improvement Results
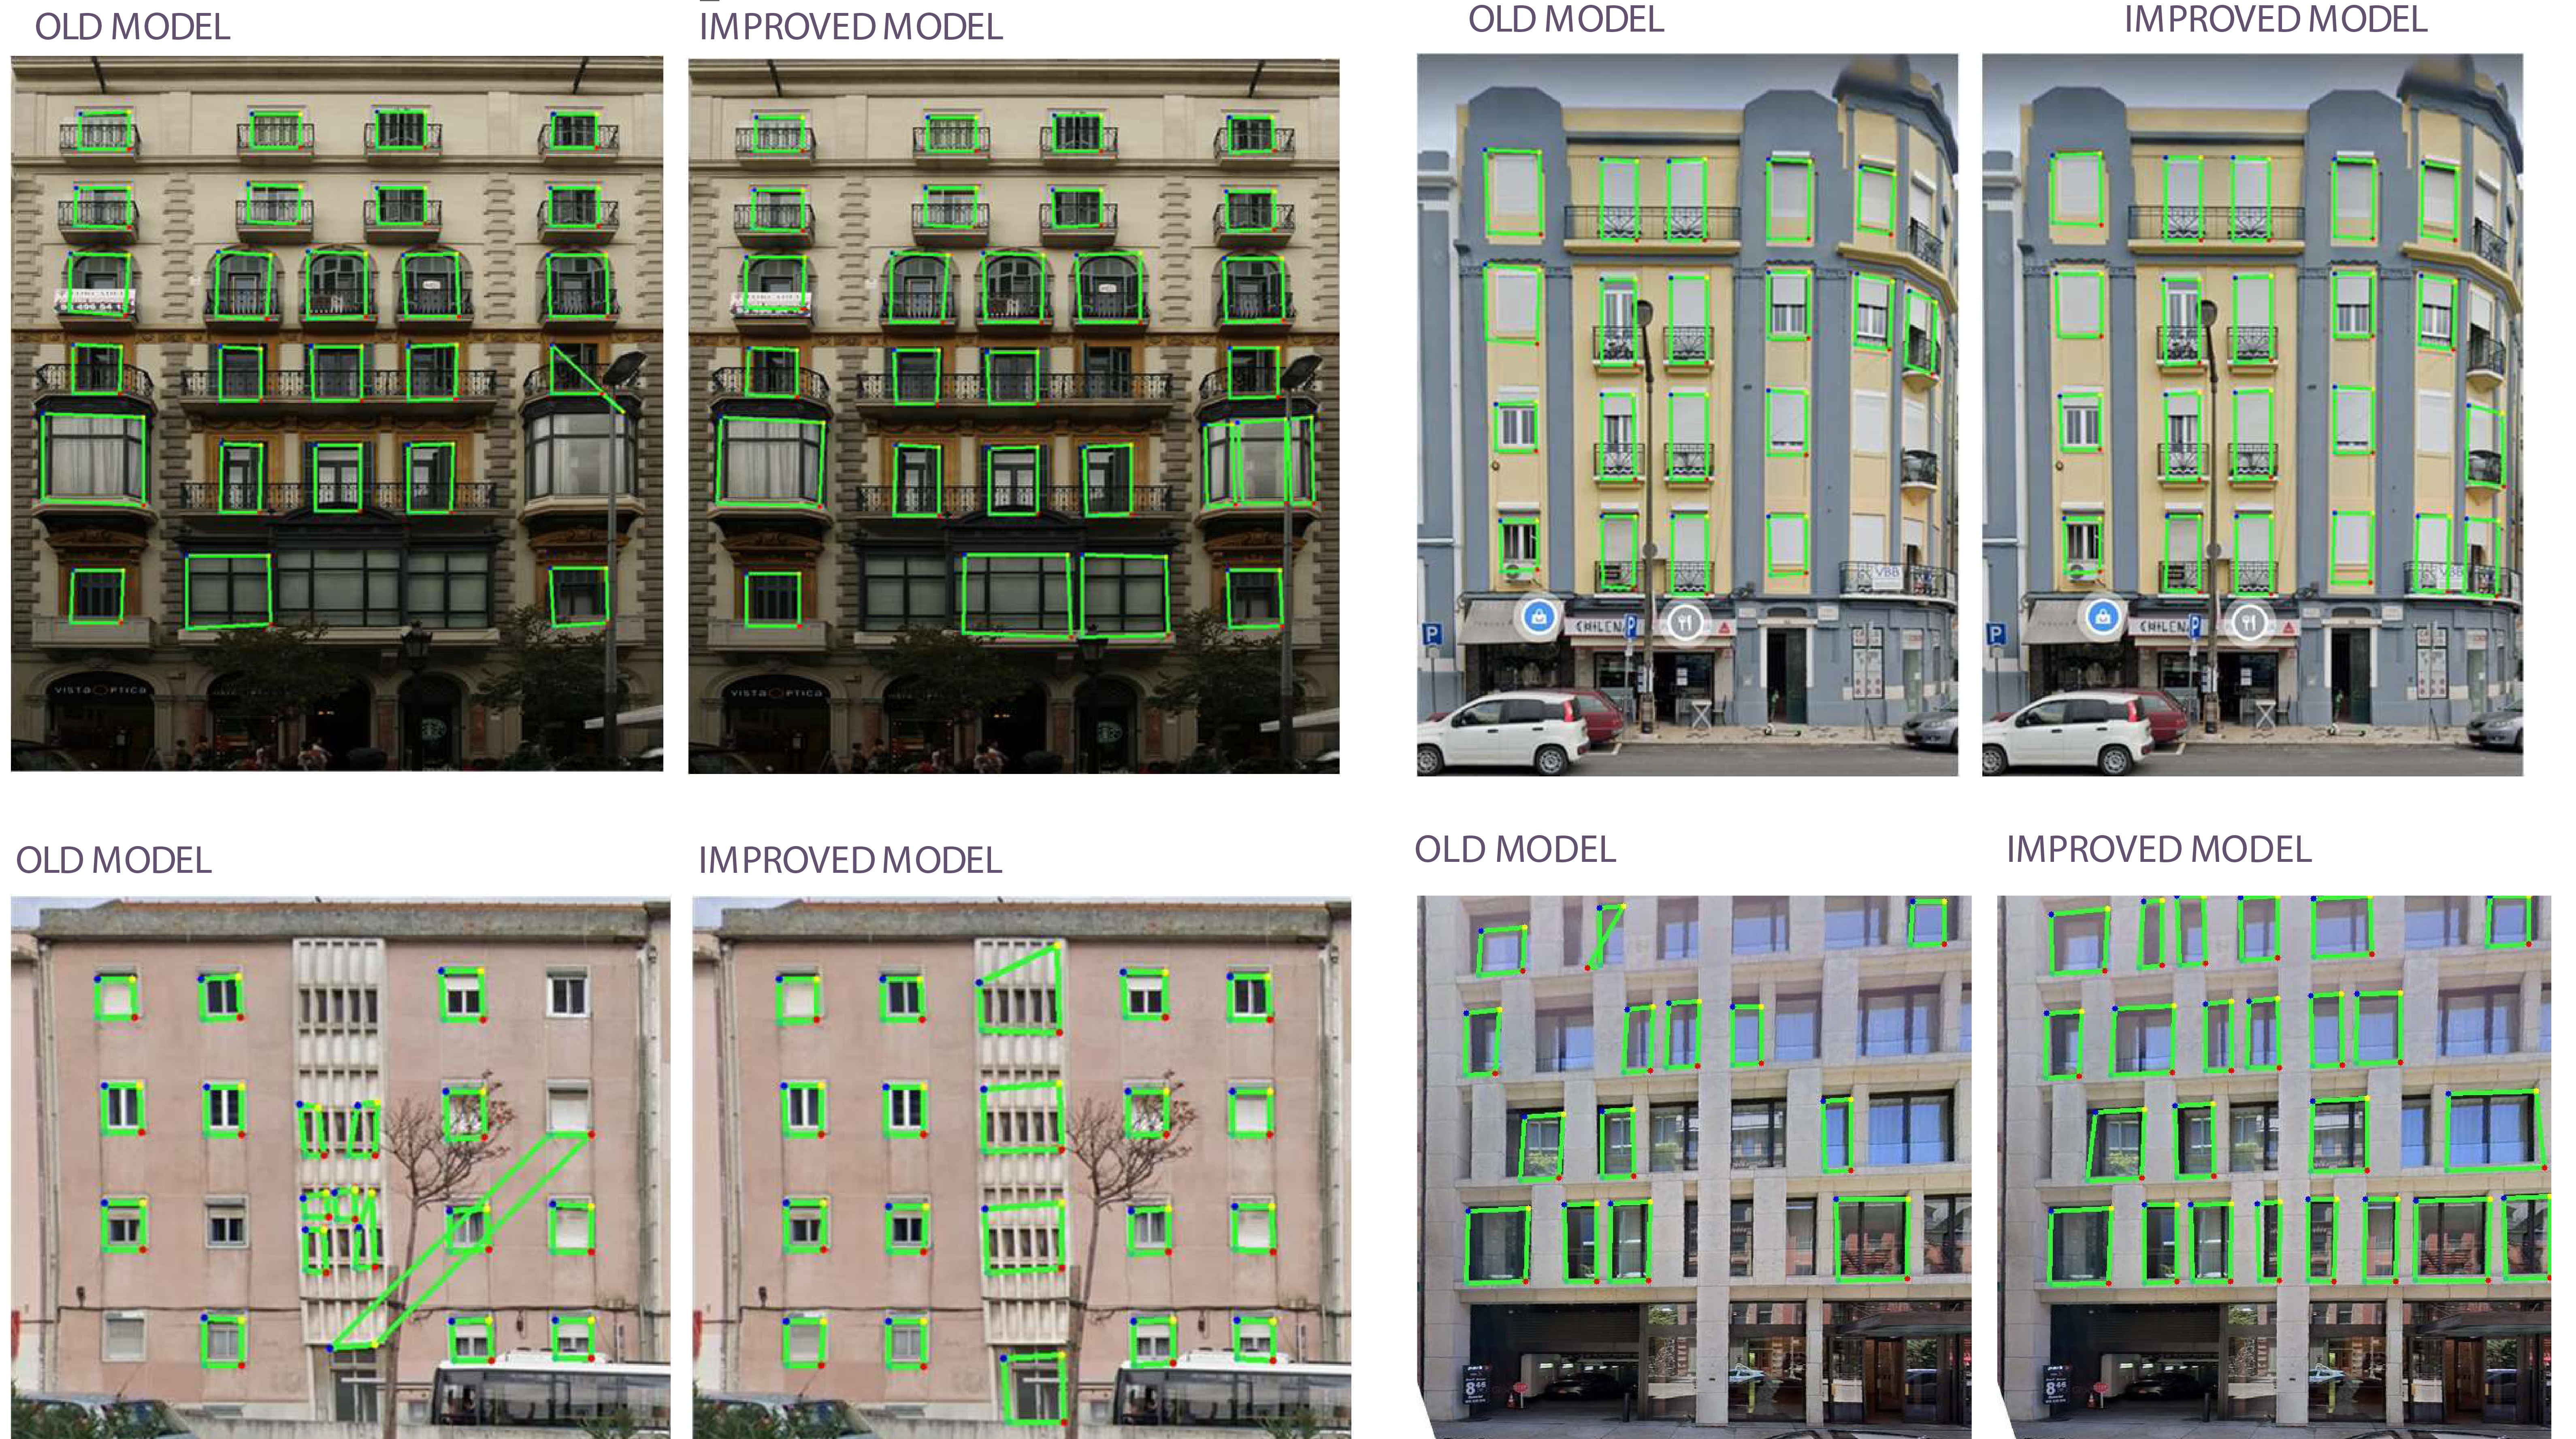
Detection differences across CNN models- from Iteration 1 (Old Model) to Iteration 4 (Improved Model)
Insights
The format of this blog intends to reflect on the methods while carrying out an experiment to compare a grammar based method against a CNN based method. The discussion intends to reflect on the outputs and their relevance to the building performance field. The below citations and linked studies provide information on more specific model architectures and parameters. Based on the above literature review and experiments, below are some discussion points for method enhancements and expanding the application of this work: